
The heart database: statistics
The following statistics complement the ones present in the papers.
Parameters of LV Function
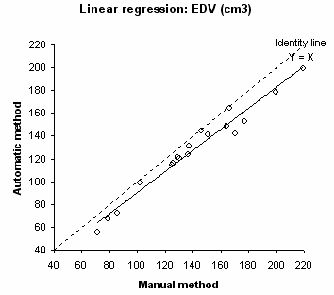
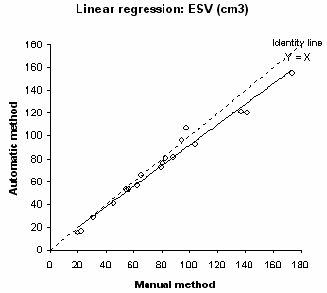
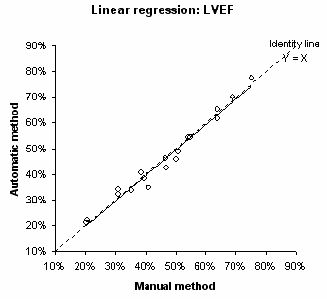
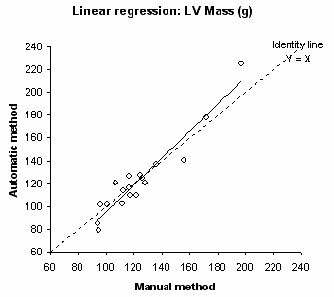
Among the 18 patients, the mean LV end-diastolic volume (EDV), end-systolic volume (ESV) and the mean LV ejection fraction were 139.7 ml (range 72-219), 79.8 ml (range 20-174), and 43% (range 20-75), respectively. Mean LV myocardial mass was 123.7 g (range 94-197).The comparisons of the mean values obtained by the 2 analyses are shown in the associated paper. The correlations for these parameters were good between the 2 methods as depicted by linear regression analysis (figure below). The regression coefficients were 0.98, 0.99, 0.99, and 0.96 for EDV, ESV, LV ejection fraction, and LV mass, respectively (all p>0.0001). Standard error estimates were 7.5 cm3, 6.7 cm3, 2.6%, and 8.3 g for EDV, ESV, LV ejection fraction, and mass, respectively.
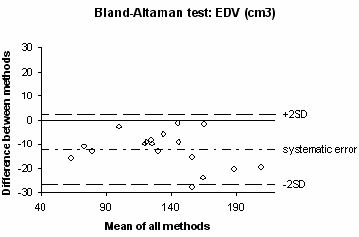
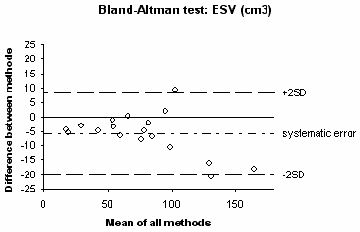
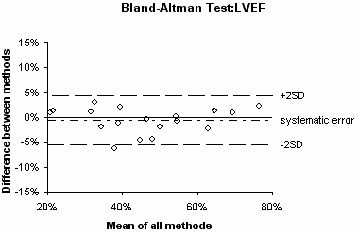
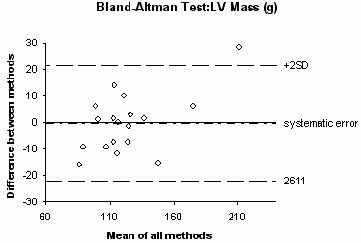
Bland-Altman plots for comparisons of EDV, ESV, LV ejection fraction, and mass are shown in the figure below. End-diastolic and end-systolic volumes were slightly but significantly lower as assessed by the automated 4D watershed technique (-12.2 and -5.8 cm3, respectively), whereas the agreement was better for LV ejection fraction and LV mass (-0.5% and -0.4g, respectively). When comparing the traces of myocardial contours obtained by the 2 methods, the difference between manual and automatic segmentation corresponded to a shift of less than one pixel in the location of the endocardial and epicardial borders.
Linear regression
 |
 |
 |
 |
Bland-Altman plots
 |
 |
 |
 |
Site info
© 2006-2007 A2SI Lab.